set.seed(123)
x <- sample(x = 1:10, replace=TRUE, size  = 10); x
[1] 3 3 10 2 6 5 4 6 9 10Generating sample data can always help me to understand any underlying concept better. Let’s explore the sample function. It takes the following parameters (Sample Range, Number of samples, Should the sample be with or without replacement). To know more about this function execute ?sample
set.seed(123)
x <- sample(x = 1:10, replace=TRUE, size = 10); x [1] 3 3 10 2 6 5 4 6 9 10The set.seed function makes sure that every time random data is generated it is the same.
A histogram basically groups data into bins. bins are also called buckets, intervals. Histogram represents the distribution of numerical data. The first step is to bin the data into a series of non overlapping intervals.
hist(x, breaks=3)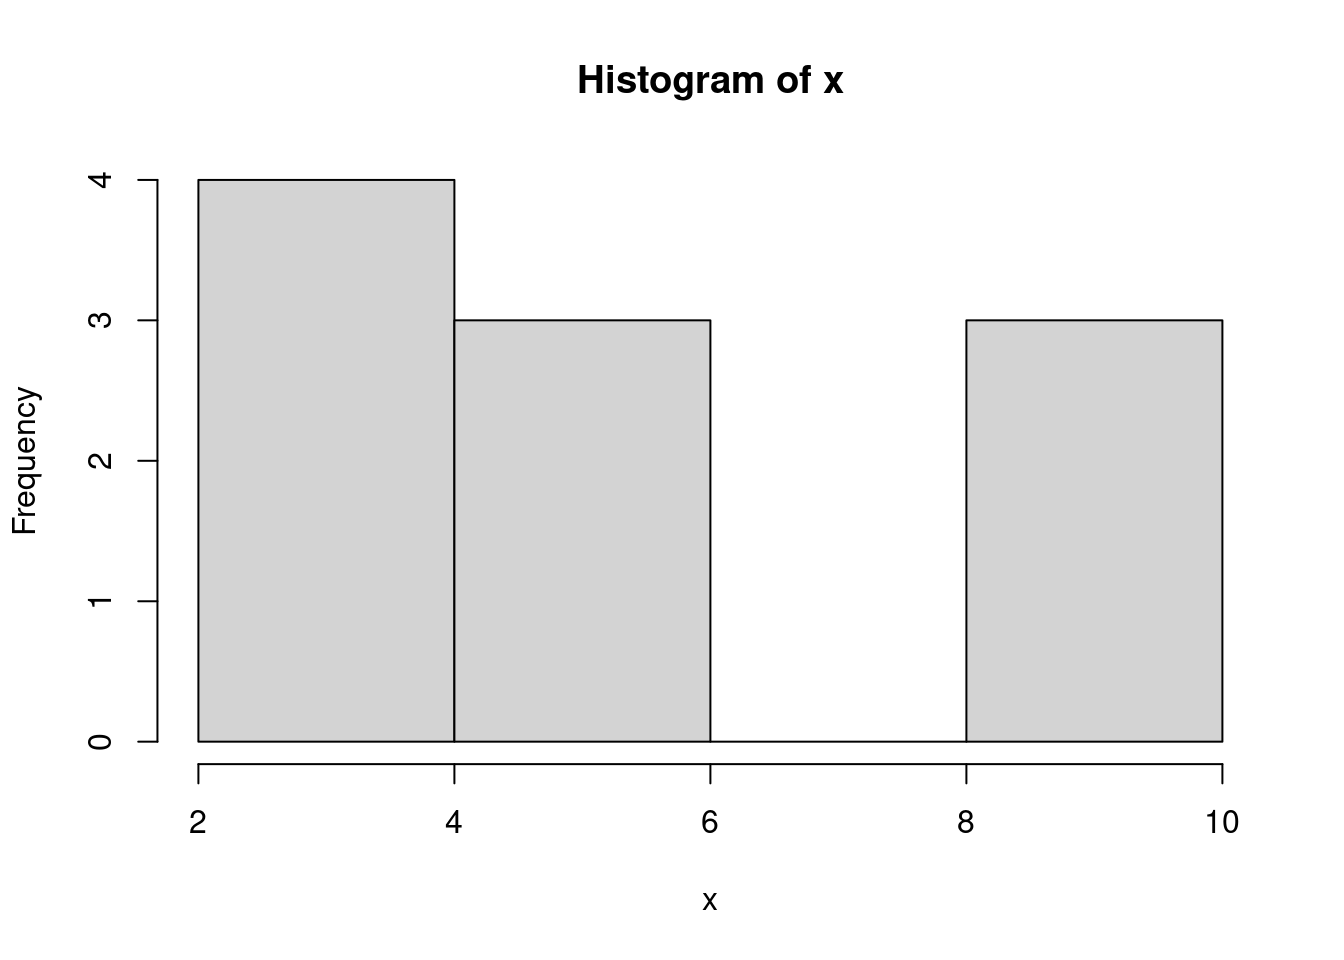
There are many practical applications of Histograms. Some of them are